About Sonars
The term sonar comes from "Sound Navigation And Ranging" and refers to a detector that uses the transmission and reception of sound waves underwater to detect objects.
In survey or other related work by private companies, sonar is mainly used to measure the submarine topography and detected objects and display their images by emitting ultrasonic waves and receiving the reflected waves from the target object.
The detection accuracy is determined by the distance to the target (speed of sound x time) and the direction of the received reflection waves. Therefore, the principle for measuring the underwater propagation speed and the direction of the received reflected waves are crucial factors that determine the accuracy.
About Differences Between Side Scan Sonar and Sub-Bottom Profiler
Side scan sonar
Side scan sonar emits sound wave pulses simultaneously from the port and starboard sides at an oblique angle.
It is a system that analyzes the sound waves reflected from various objects on the seabed and creates a high-resolution image in real time.
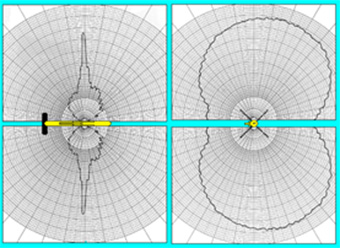
Beam pattern of side scan sonar

Concept diagram of side scan sonar and sub-bottom profiler
Example of image obtained by side scan sonar
The image obtained by side scan sonar displays the condition of the seabed like an aerial photograph. It can identify the seabed materials based on the difference of their reflection patterns, even in flat seabed. It is also suitable for urgent investigations since it can obtain images in real time without post-processing.
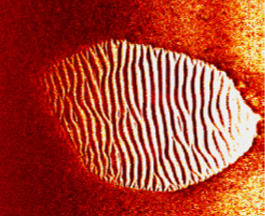
Ripple marks on the seabed surface

Scattered debris on the seabed
Side scan sonar has various frequency ranges available for different purposes.
The higher the frequency, the higher the resolution and the better the image quality, but the sound waves attenuate quickly, reducing the detection range.
| Frequency | Detectable range (one side) |
|---|---|
| 75kHz | 750m |
| 120kHz | 500m |
| 230kHz | 300m |
| 410kHz | 200m |
| 540kHz | 150m |
| 850kHz | 75m |
| 1600kHz | 35m |

Sub-bottom profiler
Sub-bottom profiler emits sound wave pulses directly below.
Using a lower frequency range of 16kHz to 500kHz, it can penetrate into the seabed layers. By detecting the pulses reflected according to the seabed-layer changes, it is a system that can create a real-time cross-sectional image of the seabed layers.
Example of image obtained by sub-bottom profiler
The image obtained by sub-bottom profiler displays the cross-sectional view of the seabed layers.
In Recording 1, the horizontal stripe-like patterns indicate the boundary between different layers. It suggests that an old layer was initially eroded, and a new layer was formed on top of it.
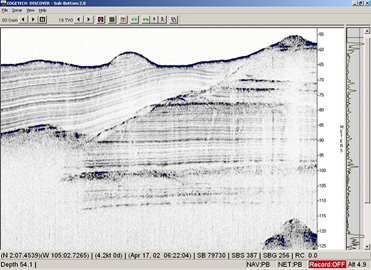
Recording 1
In Recording 2, it is thought that the central area was eroded like a river, and new layers were gradually formed over time.
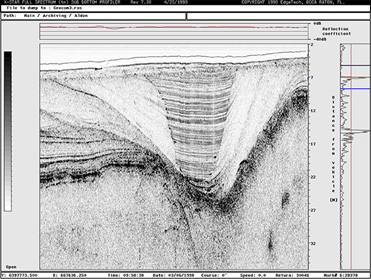
Recording 2